[影像處理_OpenCV Python]使用Python撰寫影像處理功能,圖片遮罩或濾除掉不要的地方,旋轉圖片
前言
以下範例將呈現影像處理三種不同的應用:
遮罩的實現
利用cv2.add用法來實現mask,黑色的像素0則會遮蔽掉呈現黑色,白色像素255則會透明的方式顯現出原圖的樣子濾除不要的斑點(白點)
利用 cv2.findContours用法來實現mask,黑色的像素0則會遮蔽掉呈現黑色,白色像素255則會透明的方式顯現出原圖的樣子
旋轉圖片
利用cv2.warpAffine及cv2.getRotationMatrix2D實現圖片旋轉
結果圖


程式碼範例及連結
程式範例說明
遮罩的實現
import cv2
import numpy as np
import matplotlib.pyplot as plt
'''
遮罩的實現
利用cv2.add用法來實現mask,黑色的像素0則會遮蔽掉呈現黑色,白色像素255則會透明的方式顯現出原圖的樣子
'''
# 建立300*300的白色圖像
img1 = cv2.imread('./images.jpg')
img2 = np.zeros((224, 224), dtype=np.uint8)
# 在第二張圖像上繪製一個白色圓形
cv2.circle(img2, (112, 112), 70, 255, thickness=cv2.FILLED)

# 將利用遮罩的方式取出想要的畫面
# 將彩色圖片轉換為灰度圖
img1_gray = cv2.cvtColor(img1, cv2.COLOR_BGR2GRAY)

# 將灰度圖作為遮罩,進行相加
result = cv2.add(img1_gray, img1_gray, mask = img2)

# 將結果轉換回彩色圖
result_colored = cv2.cvtColor(result, cv2.COLOR_BGR2RGB)
img2 = cv2.cvtColor(img2, cv2.COLOR_GRAY2BGR)
# 顯示原始圖片和結果
plt.subplot(1, 3, 1), plt.imshow(img1), plt.title('Image 1'), plt.axis('off')
plt.subplot(1, 3, 2), plt.imshow(img2), plt.title('Image 2'), plt.axis('off')
plt.subplot(1, 3, 3), plt.imshow(result_colored), plt.title('Result with Mask'), plt.axis('off')
plt.show()
import cv2、import numpy as np、import matplotlib.pyplot as plt:引入OpenCV、NumPy和Matplotlib庫,這些庫用於處理圖像和顯示結果。img1 = cv2.imread('./images.jpg'):讀取一張名為"images.jpg"的圖片,存儲在img1中。img2 = np.zeros((224, 224), dtype=np.uint8):創建一張大小為224x224的黑色圖片,存儲在img2中,後面將用於遮罩用。cv2.circle(img2, (112, 112), 70, 255, thickness=cv2.FILLED):在img2上畫一個白色的圓形,中心座標為(112, 112),半徑為70,顏色為255全白色,並且使用cv2.FILLED參數填充整個圓形內部。img1_gray = cv2.cvtColor(img1, cv2.COLOR_BGR2GRAY):將彩色圖片img1轉換為灰度圖,存儲在img1_gray中。result = cv2.add(img1_gray, img1_gray, mask=img2):利用cv2.add將兩張灰度圖相加,其中img2的白色部分將透明顯示原圖,黑色部分則被遮罩掉。result_colored = cv2.cvtColor(result, cv2.COLOR_BGR2RGB):將最終的結果轉換回彩色圖,以便在Matplotlib中顯示。img2 = cv2.cvtColor(img2, cv2.COLOR_GRAY2BGR):將img2轉換回彩色圖,以便在Matplotlib中顯示。- Matplotlib的部分:使用
plt.subplot和plt.imshow來顯示原始圖片、遮罩圖片和最終帶有遮罩效果的結果圖片。最後使用plt.show()顯示整體結果。
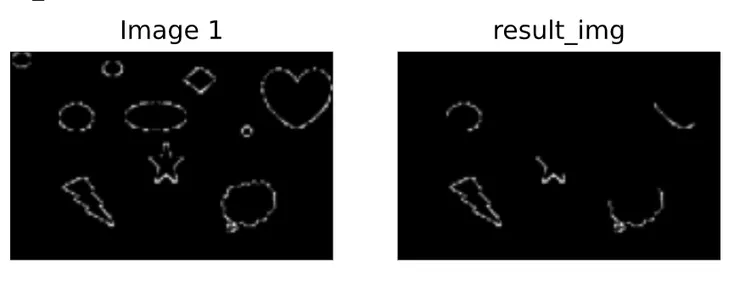
濾除不要的斑點(白點)
import cv2
import numpy as np
import matplotlib.pyplot as plt

'''
濾除不想要的斑點(白點)
cv2.findContours 主要用於找尋物體的輪廓,通常在二值圖像(黑白圖像)中找尋物體的邊界。黑白圖像中的白色區域視為物體,黑色區域視為背景,findContours 會找尋物體和背景之間的邊界
'''
def filter_contours_by_area(img:np.ndarray,min_area_threshold):
    img = cv2.cvtColor(img, cv2.COLOR_BGR2GRAY)
    # 找到輪廓
    contours, _ = cv2.findContours(img, cv2.RETR_EXTERNAL, cv2.CHAIN_APPROX_NONE)
    #找出最大最小輪廓方便設定
    max_contour = max(contours, key=cv2.contourArea)
    max_area = cv2.contourArea(max_contour)
    min_contour = min(contours, key=cv2.contourArea)
    min_area = cv2.contourArea(min_contour)
    print(f'max_area:{max_area}')
    print(f'min_area:{min_area}')
    # 過濾輪廓,將面積小於 min_area_threshold 的輪廓區域設為背景值(0)
    for contour in contours:
        area = cv2.contourArea(contour)
        if area < min_area_threshold:
            cv2.drawContours(img, [contour], -1, 0, thickness=cv2.FILLED) #將白點 轉換成黑色
    return img
#導入圖片
img1 = cv2.imread('./particle.jpg')
print(f'img1:{img1.shape}')
min_area_threshold = 1000 #設定想濾除的面積
#呼叫filter_contours_by_area函數
result_img = filter_contours_by_area(img1,min_area_threshold)

#因opencv導入圖片為BGR,PLT顯示圖片需要轉換成RGB
result_colored = cv2.cvtColor(result_img, cv2.COLOR_GRAY2BGR)
result_colored = cv2.cvtColor(result_colored, cv2.COLOR_BGR2RGB)

# 顯示原始圖片和結果
plt.subplot(1, 2, 1), plt.imshow(img1), plt.title('Image 1'), plt.axis('off')
plt.subplot(1, 2, 2), plt.imshow(result_colored), plt.title('result_img'), plt.axis('off')
plt.show()
def filter_contours_by_area(img:np.ndarray, min_area_threshold)::定義了一個函數,接受一張圖片img和最小面積閾值min_area_threshold作為參數。
contours, _ = cv2.findContours(img, cv2.RETR_EXTERNAL, cv2.CHAIN_APPROX_NONE):使用cv2.findContours找到圖片中的所有輪廓。這個函數返回輪廓的列表contours。
max_contour = max(contours, key=cv2.contourArea)
min_contour = min(contours, key=cv2.contourArea):找到面積最大和最小的輪廓。
print(f'max_area:{max_area}')、print(f'min_area:{min_area}'):印出最大和最小輪廓的面積,方便等下設定濾除面積的基準參考值。
for contour in contours::遍歷所有輪廓。
area = cv2.contourArea(contour):計算當前輪廓的面積。
if area < min_area_threshold::如果面積小於指定的最小面積閾值,則將此輪廓的區域設為背景值(0),即將白點轉換為黑色。
cv2.drawContours(img, [contour], -1, 0, thickness=cv2.FILLED)
result_img = filter_contours_by_area(img1, min_area_threshold):呼叫函數,將圖片img1濾除面積小於min_area_threshold的白點,得到result_img。
result_colored = cv2.cvtColor(result_img, cv2.COLOR_GRAY2BGR)
result_colored = cv2.cvtColor(result_colored, cv2.COLOR_BGR2RGB)
將結果圖轉換為彩色圖,因為Matplotlib與OPENCV色域不同,OPENCV為BGR的關係。
旋轉圖片
import cv2
import numpy as np
import matplotlib.pyplot as plt

def rotate_image(image, angle):
    # 取得影像中心點坐標
    center = tuple(np.array(image.shape[1::-1]) / 2)
    # 設定旋轉矩陣
    rotation_matrix = cv2.getRotationMatrix2D(center, angle, 1.0)
    # 進行影像旋轉
    rotated_image = cv2.warpAffine(image, rotation_matrix, image.shape[1::-1], flags=cv2.INTER_LINEAR)
    return rotated_image

img1 = cv2.imread('./images.jpg')

result_img = rotate_image(img1,90)

#因opencv導入圖片為BGR,PLT顯示圖片需要轉換成RGB
img1 = cv2.cvtColor(img1, cv2.COLOR_BGR2RGB)
result_colored = cv2.cvtColor(result_img, cv2.COLOR_BGR2RGB)

# 顯示原始圖片和結果
plt.subplot(1, 2, 1), plt.imshow(img1), plt.title('Image 1'), plt.axis('off')
plt.subplot(1, 2, 2), plt.imshow(result_colored), plt.title('result_img'), plt.axis('off')
plt.show()
def rotate_image(image, angle)::定義了一個函數,用於旋轉圖片。接受一張圖片image和旋轉角度angle作為參數。center = tuple(np.array(image.shape[1::-1]) / 2):取得圖片的中心點坐標。rotation_matrix = cv2.getRotationMatrix2D(center, angle, 1.0):使用cv2.getRotationMatrix2D來獲得旋轉矩陣,其中center是旋轉的中心點,angle是旋轉的角度,1.0是縮放因子。rotated_image = cv2.warpAffine(image, rotation_matrix, image.shape[1::-1], flags=cv2.INTER_LINEAR):使用cv2.warpAffine進行影像旋轉,flags=cv2.INTER_LINEAR表示使用線性插值。