Have you ever wondered how users feel when interacting with your product? Sure, you might have some guesses, but wouldn’t it be amazing to know exactly what’s working and what’s not? Why do they abandon that one feature you spent months perfecting? Why does navigating your app sometimes feel like solving a riddle than a smooth experience?
These questions highlight the importance of usability studies in improving product performance—the foundation of any successful product. A well-crafted usability design ensures your product is easy to navigate, efficient, and enjoyable for users. But how do you measure its success? That’s where Usability Testing Metrics come in.
In this blog, we’ll break down the key usability testing metrics types, explain their importance, and show you how to use these metrics to optimize your usability design for better results.
What are Usability Testing Metrics?
Usability testing metrics are quantitative measures that assess how users interact with a product in terms of effectiveness, efficiency, and satisfaction. They act as a lens to analyze user behavior, highlighting what works well and what needs refinement. These metrics are particularly useful for comparing multiple designs, tracking changes across iterations, and ensuring that design decisions lead to better usability.
Usability testing metrics are also crucial for crafting user-centered products that deliver real value. They provide measurable insights that guide UX researchers and designers in making improvements and ensuring their designs meet user needs effectively. Here’s why they’re essential:
- Leverage Data-Driven Decision-Making: Metrics like task completion rates or user satisfaction scores provide evidence of what works and what doesn’t. These data-driven insights help eliminate subjective biases, ensuring design decisions are based on facts and align with user needs and business goals.
- Boost User Satisfaction: Metrics derived from usability testing tools like the System Usability Scale (SUS) or user satisfaction ratings provide valuable insights into how users perceive your design. By analyzing these metrics to identify and address pain points, you can enhance usability, creating seamless and enjoyable experiences that lead to happier, more loyal users.
- Identify and Address Key Issues: Metrics such as error frequency and time-on-task highlight critical friction points where users struggle the most, helping you prioritize fixes that improve usability and user experience.
- Track and Measure Progress Effectively: Consistently measuring metrics across iterations ensures your product evolves in the right direction, meeting user expectations and enhancing overall satisfaction.
3 Types of Usability Testing Metrics
Product usability metrics are commonly categorized into three main types, each addressing a critical aspect of user experience: Usability Testing Metrics for Effectiveness, Usability Testing Metrics for Efficiency, and Usability Testing Metrics for Satisfaction.
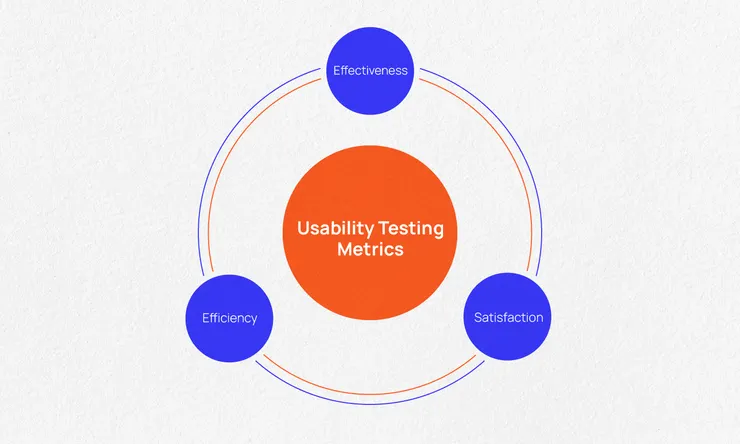
Let’s take a closer look at each category and the key metrics within them.
1. Usability Testing Metrics for Effectiveness
Effectiveness metrics focus on determining whether users can complete tasks using your product. These metrics are critical for understanding how intuitive and functional the design is, allowing teams to identify usability gaps that hinder task completion.
1.1. Success Rate
Success rate is a key product performance metric that reflects the percentage of users who complete a specific task within a product. This metric evaluates how effectively a design supports users in achieving their goals.
Metric formula:
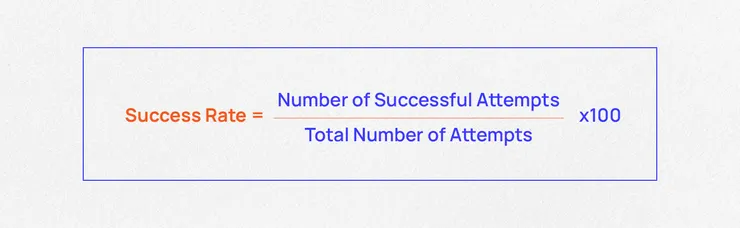
Example: If 50 participants attempt to complete a task, and 40 of them succeed, the success rate is (40/50) *100= 80%
1.2. Number of Errors
The number of errors, also known as the error rate, measures how frequently users make mistakes during usability tests. It serves as the counterpart to the success rate, highlighting usability problem areas in your product’s design.
Metric formula:
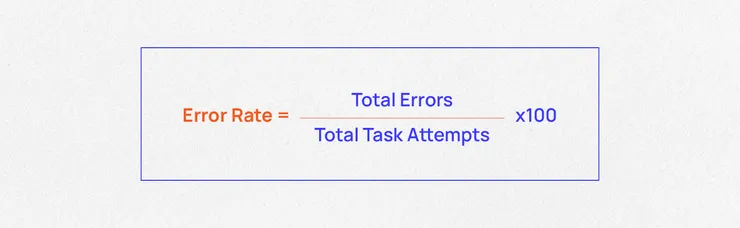
Example: If a task has 3 potential error opportunities and 10 participants attempt it (resulting in 30 total opportunities), and 4 errors are recorded.
The error rate is: 4/30×100=13.3%.
2. Usability Testing Metrics for Efficiency
Efficiency metrics assess how quickly and with how much effort users can complete tasks using your product. These metrics help identify potential bottlenecks in the user journey and provide insights into improving task completion speed and overall ease of use.
2.1. Time on task
Time on task refers to the duration it takes for a user to complete a specific task. This metric helps identify potential usability issues—such as unclear instructions, confusing interfaces, or technical bugs—by highlighting tasks that take longer than expected to complete.
Metric formula:

Example:
During Usability Testing for an e-commerce site, 5 users are asked to add an item to the cart. The time each user spends is recorded as follows:
- User 1: 45 seconds
- User 2: 60 seconds
- User 3: 50 seconds
- User 4: 55 seconds
- User 5: 40 seconds
Time on Task (Average)= (45+60+50+55+40)/5=50 seconds
Suppose the expected time for this task is around 20 seconds. In that case, the result indicates that users are taking significantly longer, which may be due to issues like an unclear “Add to Cart” button or a distracting layout.
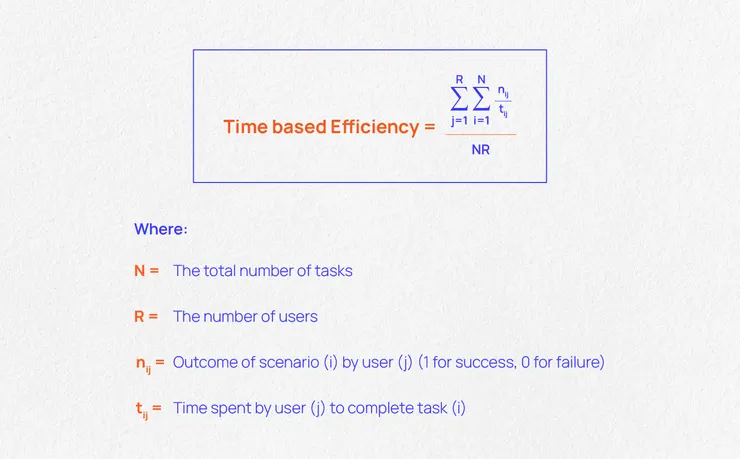
2.2. Time-based efficiency
Time-based efficiency measures how many tasks users can complete within a given amount of time. It provides a balanced view of both speed and accuracy, highlighting overall productivity.
Metric formula:
Example: You are testing a new mobile banking app by observing how users complete a single task: transferring money to a saved contact. The usability test involves 5 users attempting the same task.
Results:
- User 1: Completes the task in 5 seconds.
- User 2: Completes the task in 8 seconds.
- User 3: Completes the task in 7 seconds.
- User 4: Attempts the task but gives up after 10 seconds.
- User 5: Completes the task in 6 seconds.
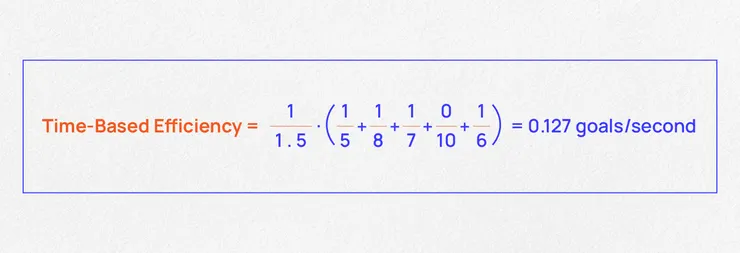
Taking the above equation:
- N (Total number of tasks): 1
- R (Number of users): 5
- User 1: Nij = 1 and Tij = 5
- User 2: Nij = 1 and Tij = 8
- User 3: Nij = 1 and Tij = 7
- User 4: Nij = 0 and Tij = 10
- User 5: Nij = 1 and Tij = 6
Placing the above values in the equation:
3. Usability Testing Metrics for Satisfaction
Satisfaction metrics evaluate how users feel about their experience with your product, capturing their emotions, preferences, and overall comfort. These metrics provide valuable insights into user perceptions, helping to identify areas where improvements can enhance usability and satisfaction.
3.1. Task Level Satisfaction
Task-level satisfaction measures how users feel immediately after completing a specific task. This metric is typically measured through:
- Single Ease Question (SEQ): A straightforward survey that asks users to rate their experience using a numerical scale.
Example: After completing a flight booking online, a pop-up message appears with the question: “How easy was it to book your flight?” The user then selects a rating from 1 (Very Difficult) to 7 (Very Easy) based on how they felt about the process.
- After Scenario Questionnaire (ASQ): A more detailed survey with multiple testing questions that assesses various aspects of the task’s overall experience. It is rated on a numerical scale for detailed feedback.
Given the above example, as user completing a flight booking, a pop-up appears saying: “We’d love your feedback!” It then presents a series of questions like: “How easy was it to find an available flight?” (1: Very Difficult; 7: Very Easy), “Was the booking process clear and straightforward?” (1: Not at All Clear; 7: Very Clear), or “How satisfied are you with the overall booking experience?” (1: Very Dissatisfied; 7: Very Satisfied). These questions help gather detailed insights into the user’s experience.
3.2. Test Level Satisfaction
Test-level satisfaction measures the overall user experience and satisfaction after completing all tasks in a usability test. Unlike task-level satisfaction, this metric provides a broader view of how users perceive the product as a whole. It helps teams understand whether the product meets user expectations across all features and functionalities.
Test-level satisfaction is typically assessed at the end of the usability test through System Usability Scale (SUS). This is a widely used standardized questionnaire consisting of 10 questionnaire rated on a 1–5 scale (1 = Strongly Disagree, 5 = Strongly Agree), yielding a score from 0 to 100 to assess usability.
Example: After testing a mobile app, users complete the SUS questionnaire, which includes items such as: “I think I would use this product frequently.” or “I found the system unnecessarily complex.” The responses are scored and normalized. A score of 70 indicates average usability, while scores above 70 suggest good usability, and scores below 70 highlight areas that need improvement.
Exciting Year-end Opportunity
This year-end, don’t miss your chance to claim a FREE UX Audit through our exclusive WinAudit 2024 campaign. Discover actionable insights and uncover key improvement areas in your product using 10 Heuristic Usability and proven Design Principles to gain a competitive edge in 2025.
Don’t miss out—this opportunity won’t last long! Register now and take the first step toward innovation and success!
Conclusion
Measuring usability is essential for understanding your product’s performance and addressing issues before they grow into bigger problems. There are many usability testing metrics available, each offering unique insights into product efficiency metrics and user experience. It’s essential to choose your metrics carefully and avoid relying on just one for a complete evaluation.
If you’re looking for a UX Audit service provider to evaluate and enhance your digital product, our team of design experts is ready to conduct thorough product usability tests, providing a detailed evaluation report tailored to your unique needs.
As a leading UI/UX design studio, Lollypop specializes in delivering comprehensive product development from UX Research, Product Design, and Development across various digital platforms.
Contact us today to schedule a FREE consultation and explore how we can implement usability testing standards to enhance your product’s user experience!
Read more: 8 Common Usability Testing Methods in User-Centered Design
Frequently Asked Questions (FAQs)
- How many types of Usability Testing Metrics?
There are three main types of usability testing metrics: Effectiveness, Efficiency, and Satisfaction. These metrics assess whether users can complete tasks, how quickly they can do so, and how satisfied they feel with their experience. - Can Usability Metrics be combined?
Yes, combining usability metrics provides a more comprehensive view of the user experience. For example, pairing success rate (Effectiveness) with time on task (Efficiency) and Satisfaction scores gives insight into both performance and user perception. - How often should Usability Metrics be collected?
Usability metrics should be collected regularly, including during prototyping, pre-launch testing, and post-launch monitoring. This ensures that usability problems are identified early and that improvements align with user needs over time.